| Horizontal Thermomether | |
 |
|
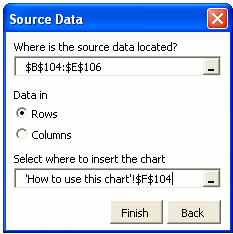
| After choosing the type of Excel chart click the next button. Now in the box of dialogue Source Data select the range with the data for the Excel chart. You can choose to display by rows or columns. |
|
 |
 |
| Finally press the finish button to insert the Excel graphic. | |
 |
|
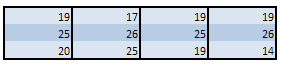
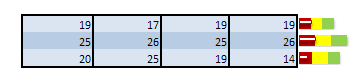
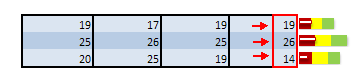
| It´s important to note that for this type of Excel graphic the last data column will represent the progress indicator series in the Excel chart, so that the value of the indicator for the first graphic is 19, the value for the second Excel graphic is 26, the value of the indicator for the third figure is 19 and the advance indicator will be 14. | |
 |
|