| Insert Special Charts |
| With this function you will be able to access to the Excel graphics gallery which are not native from Excel. | |
|
- Bubble in Axis - Dot Plot - Tornado Chart - Dot - Waterfall Chart - Box Plot - Double Doughnut - Cube with percentage - Circle chart - Pie in pie - Column with categories |
- Marimekko Chart - Cascade - Lines(max-min) - Lines(high, average, low) - Lines(max, high, average, low, min) - Multiple progress indicator - Widget label |
| A Dialog box will be displayed: | |
 |
|
| Choose the range where the data is located: | |
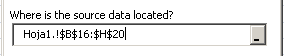 |
|
| Select where to insert the Excel chart: | |
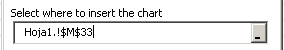 |
|
| In order to create a Excel graphic press the button Finish. |
|
 |
|
|
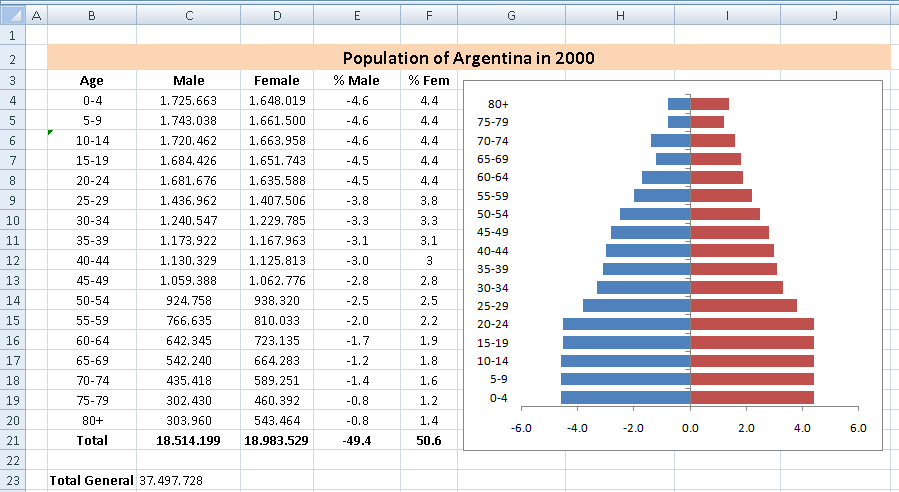
When creating this type of Excel graphic, a hidden sheet will be created with the corresponding data. This kind of Excel graphic does not allow to display changes from the Excel graphic data directly, it will be necessary to create a new Excel graphic to show modifications in the data. |
|
|
Sample: |
|
 |
|
|
In order to get a wished Excel chart, choose a Excel graphic. Then select : how to insert the example > as a new sheet or new workbook. |
|