| Waterfall Chart |
 |
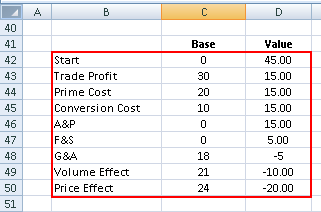
| Waterfall Chart is a form of data visualization which helps in determining the cumulative effect of sequentially. |
| For this type of Excel graphic the data must have the following structure. |
|
 |
 |
| Waterfall Chart |
|
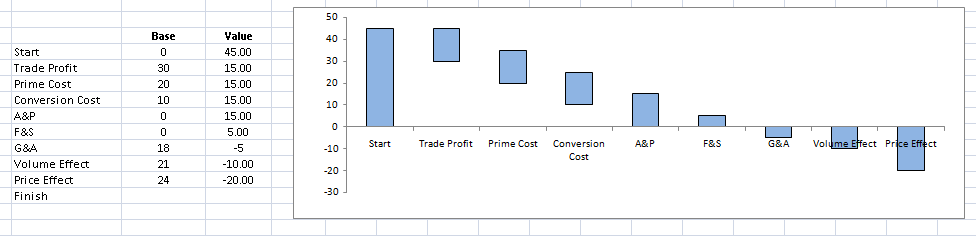
| Waterfall Chart is a form of data visualization which helps in determining the cumulative effect of sequentially. |
| For this type of Excel graphic the data must have the following structure. |
|
|
|