| Pie |
 |
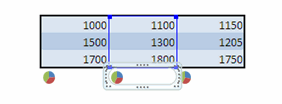
| For this example we will select the pie chart type, and then press next . |
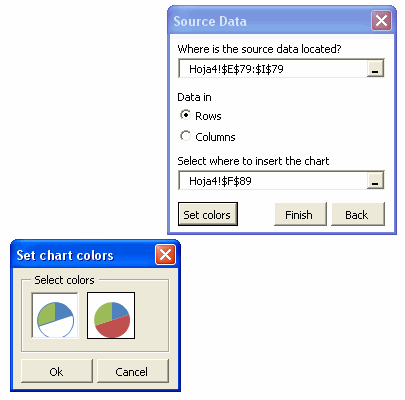
| Then in the dialogue box Source Data select the range to be used for the graphic. |
 |
| The last step, we choose to view the data in columns and we press Finish. |
| This is the result. |
 |
Pie - Set chart colors When selecting the Excel graphic of type pie, this has the possibility to show Excel chart with colors by default in Excel or create the last serie without color. As it is shown in the dialog box "Set chart colors". |
 |