| Add Label |
Add labels to your charts with this tool, either to them all or to selected ones.
Alternatively, right click on the Chart and select SP Chart Tools/Example
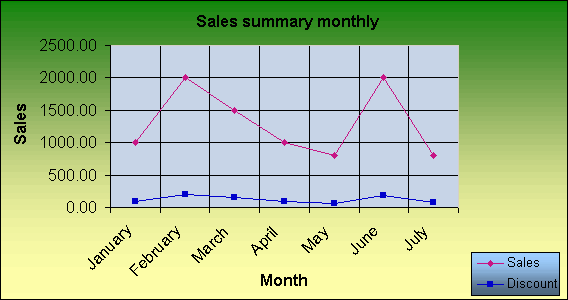
Two monthly series have been defined, Sales and Discount to our customers, in US Dollars.

With the above data, generate the chart below.

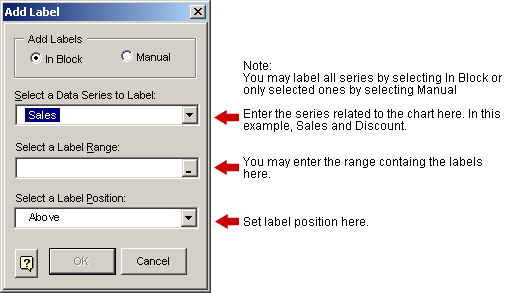
First select the chart, then access the dialog below from the SP General Tools toolbar.
You may also access this tool by right-clicking on the chart and selecting SP Chart Tools/Add Labels. The same dialog will appear.

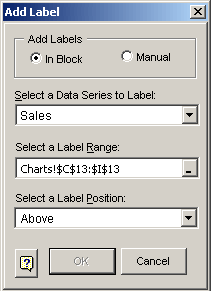
In this example, choose these settings: In Block, and the following source range:

Although the default Above label position has been selected in this example,
you may choose other options, namely: Below, Left, Right, and Center

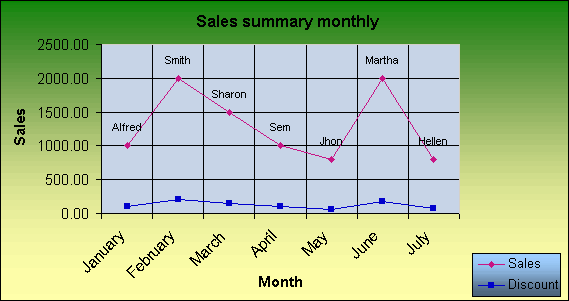
The labeled chart will look like this:
