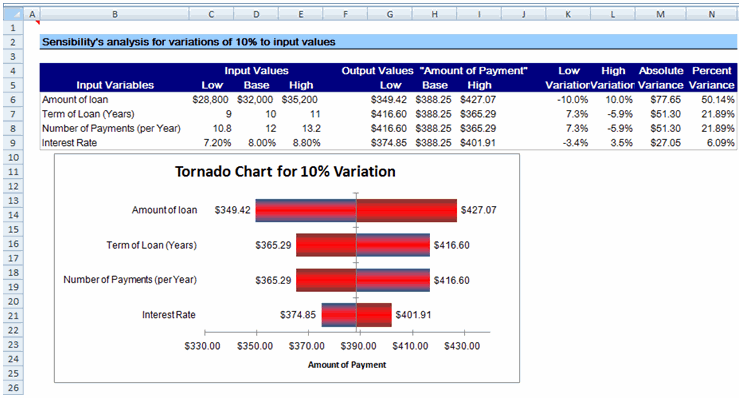

Create Tornado Analysis
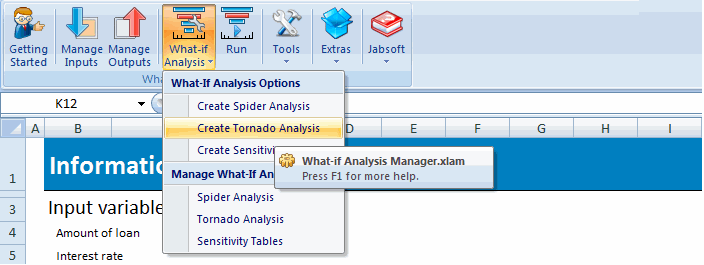
With it, you can apply to input variable values a percent variation to the left and another of the same size to the right. This allows you to immediately spot which inputs the resulting output variables are most sensitive to; in addition, you can see a chart that shows the input variables ordered from the most to the least impact on the output.
You will find this tool helpful when you don't know which variables should be handled more carefully on account of the resulting variations in the model, as a small change in them may have large impact on the output.
You should first select the input variables and the output variable, as shown in the screenshots below. You can work with as many as 20 inputs and 1 output each time you run the tool.
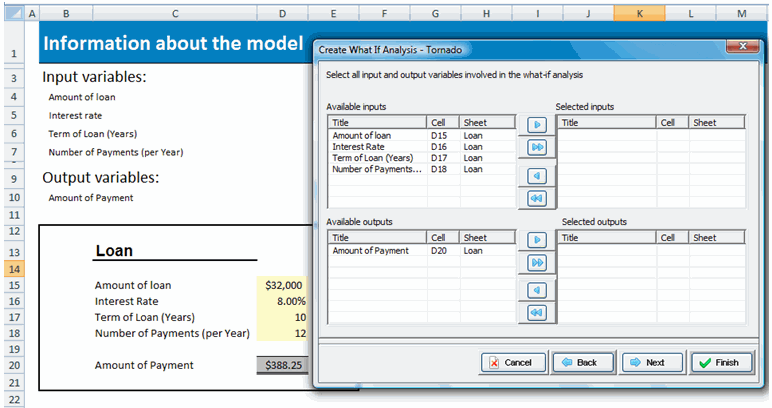
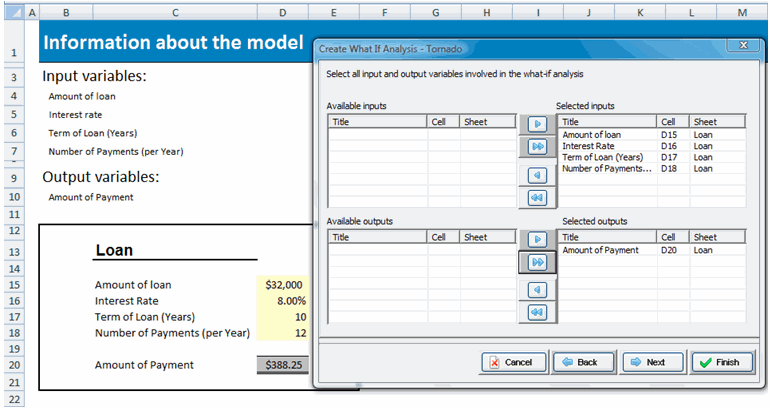
When you click Next, a dialog will pop up as that shown below. Here you can modify the default percent change value for all inputs. In addition, you can save the tornado analysis and rerun it with Run What-If Analysis.
You can edit a saved model with Manage Tornado Analysis.
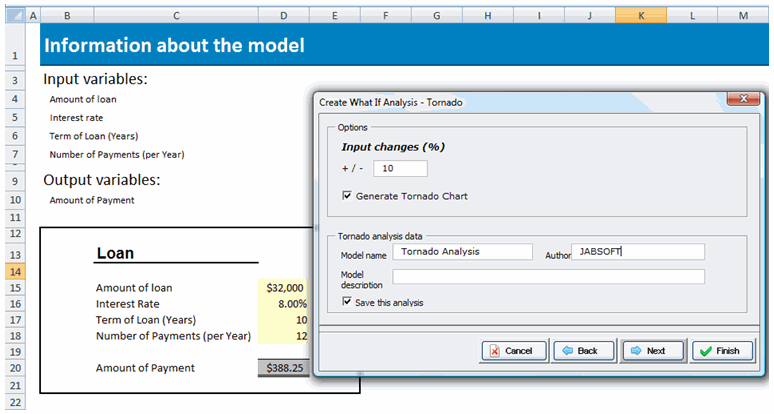
You can see the result in the following image.
